Smart: MOT pass rate and reliability
Smart vehicles pass the MOT first time 77.6% of the time, measured across 87,442 DVSA tests. That is 0.6 points better than the 77% national average, ranking Smart 28 of 50 major brands sold in the UK.
Looking at a written-off Smart rather than a roadworthy one? The median recorded closing bid for a damaged Smart was £550, from 23 ended listings across every Smart model. These bids are not independently confirmed sales.
Bidding on a damaged Smart at Copart? Run the lot through the salvage profit analyzer for the repair cost, fees, VAT and your maximum bid. Buying a used Smart, damaged or not? Run its registration through the free vehicle history check first: these are brand averages, that page checks the exact car.
Every brand ranked
- Ferrari - 95.9%
- LEVC - 95.4%
- Aston Martin - 93.2%
- Bentley - 92.5%
- Porsche - 88.7%
- Lexus - 87.7%
- Tesla - 84.8%
- Maserati - 84.3%
- MG - 83.9%
- BMW - 82.5%
- Jaguar - 81.9%
- Abarth - 81.8%
- Audi - 81.6%
- MINI - 81.6%
- Toyota - 81.3%
- Land Rover - 80.6%
- Skoda - 80.6%
- Mercedes-Benz - 79.9%
- Suzuki - 79.5%
- Kia - 78.9%
- Hyundai - 78.8%
- SEAT - 78.7%
- Subaru - 78.6%
- Honda - 78.3%
- Dacia - 78.3%
- Volvo - 78.2%
- Jeep - 78%
- Smart - 77.6%
- Volkswagen - 77.1%
- Mazda - 77%
- Mitsubishi - 76.9%
- DS - 76.2%
- London Taxis International - 75.5%
- Ford - 74.8%
- Isuzu - 73.7%
- Nissan - 73.4%
- Peugeot - 73.2%
- Fiat - 73%
- Ssangyong - 73%
- Vauxhall - 72.4%
- Alfa Romeo - 72.4%
- Citroen - 70.8%
- Iveco - 70.2%
- Rover - 70.2%
- Saab - 69.1%
- Renault - 68.1%
- Chrysler - 67.2%
- Daihatsu - 67.1%
- Chrysler-Jeep - 67%
- Chevrolet - 62.8%
Smart models
- Smart (Mcc) Forfour - 78.6%, 22,828 tests
- Smart (Mcc) Fortwo - 84.5%, 22,759 tests
- Smart (Mcc) Fortwo Coupe - 70.9%, 18,413 tests
- Smart (Mcc) City Coupe - 66.3%, 4,269 tests
- Smart (Mcc) Fortwo Cabriolet - 72.8%, 4,086 tests
- Smart Fortwo Passion Mhd Auto - 75.9%, 2,794 tests
- Smart Roadster 80 Auto(Rhd) - 72.3%, 912 tests
- Smart (Mcc) Roadster - 74.8%, 810 tests
- Smart (Mcc) Cabriolet - 71.5%, 786 tests
- Smart Fortwo Pulse Mhd Auto - 76.1%, 679 tests
- Smart (Mcc) City Cabriolet - 66.1%, 658 tests
- Smart City Passion 61 Auto - 67.5%, 590 tests
Most common MOT failures across every Smart
Pooled across all Smart models, not just one: what actually fails on a Smart more than the UK average.
- Lambda coefficient outside the default limits or the range specified by the manufacturer, 2% of tests (3.86x the national rate for this defect)
- Significant brake effort recorded with no brake applied indicating a binding brake, 1.6% of tests (1.57x the national rate for this defect)
- Stop lamp missing, inoperative or in the case of a multiple light source more than 1/2 not functioning, 2% of tests (1.48x the national rate for this defect)
- The aim of a headlamp is not within limits laid down in the requirements, 3.2% of tests (1.37x the national rate for this defect)
- A spring or spring component fractured or seriously weakened, 3% of tests (1.33x the national rate for this defect)
- Wiper blade missing or obviously not clearing the windscreen, 2.4% of tests (1.28x the national rate for this defect)
- Brake pipe damaged or excessively corroded, 1.3% of tests (1.24x the national rate for this defect)
- Engine MIL illuminated indicating a malfunction, 1.5% of tests (1.21x the national rate for this defect)
- A suspension pin, bush or joint excessively worn, 4.2% of tests
- Tyre tread depth not in accordance with the requirements, 3.5% of tests
From 74,747 DVSA-tracked Smart tests, 2024. DVSA testers marked 5.3% of these flagged defects as "dangerous", against 5.11% nationally.
Most common MOT advisories across every Smart
An advisory doesn't fail the car - the tester flags it as worth watching, but it still passes. Pooled across all Smart models, this is a different list from the failures above.
- Lamp emitted colour, position or intensity not in accordance with the requirements, 2.2% of tests (1.58x the national rate for this advisory)
- Brake pipe damaged or excessively corroded, 8.7% of tests (1.4x the national rate for this advisory), also fails
- A tyre seriously damaged, 20.8% of tests (1.35x the national rate for this advisory)
- Tyre tread depth not in accordance with the requirements, 22.6% of tests, also fails
- Brake disc or drum excessively weakened, insecure or fractured, 9.6% of tests
- A suspension pin, bush or joint excessively worn, 7.8% of tests, also fails
- a brake lining or pad worn below 1.5mm, 6% of tests
- Fluid leaking excessively and likely to harm the environment or to pose a safety risk to other road users, 4.1% of tests
- A spring or spring component fractured or seriously weakened, 3.3% of tests, also fails
- Brake disc or drum significantly and obviously worn, 3.2% of tests
From 74,747 DVSA-tracked Smart tests, 2024.
More on brand reliability
- Britain's most and least reliable car brands: MOT pass rate by manufacturer
- Which car brands beat their age on the MOT test? 33 million tests, ranked
- The cheapest, most reliable makes to buy at salvage auction
Embed this data
Run a site about Smart? Embed the real DVSA pass-rate badge free, linked back to this page.
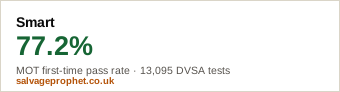
<a href="https://www.salvageprophet.co.uk/mot/make/smart"><img src="https://www.salvageprophet.co.uk/badge/make/smart.svg" width="340" height="92" alt="Smart MOT Pass Rate: 77.6% - Salvage Prophet"></a>Run a garage or parts site? Embed Smart's top real failure reason instead, linked back here.
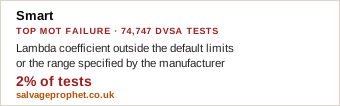
<a href="https://www.salvageprophet.co.uk/mot/make/smart"><img src="https://www.salvageprophet.co.uk/badge/make/failure/smart.svg" width="340" height="106" alt="Smart most common MOT failure: Lambda coefficient outside the default limits or the range specified by the manufacturer (2% of tests) - Salvage Prophet"></a>