Suzuki Swift: MOT pass rate and reliability data
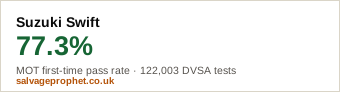
The Suzuki Swift passes its MOT first time more often than the average UK car, by 0.6 percentage points. These figures come from the DVSA's full year of anonymised MOT results, covering 122,003 individual Suzuki Swift tests. Nothing here is an estimate or a survey.
The numbers
| First-time pass rate | 77.3% |
| UK national average | 76.7% |
| Difference | +0.6 points |
| Tests analysed | 122,003 |
| Average mileage at test | 64,861 miles |
| Average year of manufacture | 2013 |
| Reliability rank | 1,541 of 2,005 models |
What this means if you are buying one
A 77.3% first-time pass rate means roughly 23 in every 100 Suzuki Swifts presented for MOT fail on the first attempt. That is better than average, so a well-kept example is a reasonably safe used buy. The average Suzuki Swift tested had covered 64,861 miles and was built around 2013.
What this means at salvage auction
Pass rate is a proxy for what a car costs to keep on the road. The Suzuki Swift sits 0.6 points above the national average, ranked 1,541 of 2,005 models. On one bought as repairable salvage, the mechanical side is less likely to spring surprises, so your repair estimate should hold up reasonably well.
Before you bid: run the lot through the analyzer, check the car's own record, check the mileage, decode the VIN, and if it carries a marker use the write-off value calculator. Or compare it against another model.
Looking at a specific Suzuki Swift rather than the model in general? The free check covers its MOT and mileage history, and the full HPI report confirms the insurance write-off category, outstanding finance and whether it is recorded stolen, from licensed data for 5 credits. Already own one that has been damaged? Work out whether fixing it beats selling it with the repair or scrap calculator, and see the median recorded closing bid for a damaged Suzuki Swift: £350 at UK salvage auction, from 15 ended listings, not independently confirmed sales.
Most common MOT failures on a Suzuki Swift
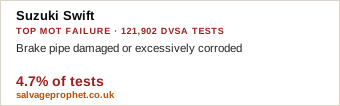
- Brake pipe damaged or excessively corroded, 4.7% of tests (4.42x the national rate for this defect)
- Significant brake effort recorded with no brake applied indicating a binding brake, 2.2% of tests (2.08x the national rate for this defect)
- Stop lamp missing, inoperative or in the case of a multiple light source more than 1/2 not functioning, 2.6% of tests (1.91x the national rate for this defect)
- Parking brake efficiency below minimum requirement, 2.3% of tests (1.76x the national rate for this defect)
- A lamp missing, inoperative or in the case of a multiple light source more than 1/2 not functioning, 3.9% of tests (1.75x the national rate for this defect)
- Wiper blade missing or obviously not clearing the windscreen, 2.9% of tests (1.52x the national rate for this defect)
- A suspension joint dust cover missing or no longer prevents the ingress of dirt etc, 2.5% of tests (1.37x the national rate for this defect)
- A shock absorber damaged to the extent that it does not function or showing signs of severe leakage, 1.2% of tests (1.29x the national rate for this defect)
- A suspension pin, bush or joint excessively worn, 6.4% of tests (1.26x the national rate for this defect)
- Tyre tread depth not in accordance with the requirements, 3.3% of tests
From 121,902 DVSA-tracked Suzuki Swift tests, 2024. DVSA testers marked 3.92% of these flagged Suzuki Swift defects as "dangerous", meaning the tester judged the car unsafe to drive away, against 5.11% nationally.
Most common MOT advisories on a Suzuki Swift
An advisory doesn't fail the car - the tester flags it as worth watching, but it still passes. A different list from the failures above: what testers are noting on a Suzuki Swift before it actually fails on it.
- Brake pipe damaged or excessively corroded, 24% of tests (3.88x the national rate for this advisory), also fails
- A brake hose ferrule excessively corroded, 4% of tests (3.16x the national rate for this advisory)
- Significant brake effort recorded with no brake applied indicating a binding brake, 3.9% of tests (1.96x the national rate for this advisory), also fails
- A tyre seriously damaged, 22.9% of tests (1.48x the national rate for this advisory)
- The strength or continuity of the load bearing structure within 30cm of any sub-frame, spring or suspension component mounting (a 'prescribed area') is significantly reduced or inadequately repaired, 2.2% of tests (1.42x the national rate for this advisory)
- A suspension pin, bush or joint excessively worn, 16.7% of tests (1.25x the national rate for this advisory), also fails
- Tyre tread depth not in accordance with the requirements, 22.6% of tests, also fails
- Brake disc or drum excessively weakened, insecure or fractured, 9.6% of tests
- a brake lining or pad worn below 1.5mm, 6.3% of tests
- A suspension component excessively damaged or corroded, 5.4% of tests
From 121,902 DVSA-tracked Suzuki Swift tests, 2024.
Suzuki Swift pass rate by model year
From its 2005 to its 2020 model year, the Suzuki Swift's first-time pass rate has risen 37.7 points, from 57% to 94.7%, the usual pattern: a newer model year is a younger car today, so it fails less. First-time pass rate for each Suzuki Swift year:
- 2005 Suzuki Swift - 57% first-time pass, 1,351 tests
- 2006 Suzuki Swift - 57.8% first-time pass, 4,108 tests
- 2007 Suzuki Swift - 58.3% first-time pass, 7,193 tests
- 2008 Suzuki Swift - 58.9% first-time pass, 7,461 tests
- 2009 Suzuki Swift - 61.5% first-time pass, 6,994 tests
- 2010 Suzuki Swift - 64.6% first-time pass, 6,087 tests
- 2011 Suzuki Swift - 72.7% first-time pass, 6,293 tests
- 2012 Suzuki Swift - 77% first-time pass, 9,076 tests
- 2013 Suzuki Swift - 79.5% first-time pass, 8,763 tests
- 2014 Suzuki Swift - 81.6% first-time pass, 10,082 tests
- 2015 Suzuki Swift - 84.7% first-time pass, 12,402 tests
- 2016 Suzuki Swift - 86.8% first-time pass, 10,503 tests
- 2017 Suzuki Swift - 88.3% first-time pass, 8,108 tests
- 2018 Suzuki Swift - 89.3% first-time pass, 10,200 tests
- 2019 Suzuki Swift - 91.5% first-time pass, 10,999 tests
- 2020 Suzuki Swift - 94.7% first-time pass, 1,236 tests
Suzuki Swift by fuel type
The Suzuki Swift's two most-tested fuel types split by 12.5 points: petrol passes first time 77.3% of the time (112,708 tests) against 89.8% for hybrid (6,115 tests).
- Petrol Suzuki Swift - 77.3% first-time pass, 112,708 tests
- Hybrid Suzuki Swift - 89.8% first-time pass, 6,115 tests
- Diesel Suzuki Swift - 62.6% first-time pass, 2,612 tests
Other Suzuki models
- Suzuki Vitara - 88.6%
- Suzuki Alto - 74%
- Suzuki Sx4 - 75%
- Suzuki Celerio - 90%
- Suzuki Jimny - 72.9%
- Suzuki Ignis - 79.8%
- Suzuki Grand Vitara - 68.2%
- Suzuki Splash - 68.4%
Models with a similar pass rate
- Lexus Gs300 - 77.4%
- Citroen Berlingo 1000 En-Prise Bluehdi - 77.4%
- Porsche 944 - 77.4%
- Citroen C3 Picasso - 77.3%
- Citroen Dispatch 1200 En-Prise Bhdi Ss - 77.3%
- Mazda Mx-5 - 77.2%
If this car is a salvage or write-off
- What does Cat N mean? Category N explained
- What does Cat S mean? Category S explained
- Cat S vs Cat N: the real differences
- Do you need an HPI check on a car you know is a write-off?
Embed this data
Run a site about the Suzuki Swift? Embed the real DVSA pass-rate badge free, linked back to this page.
<a href="https://www.salvageprophet.co.uk/mot/suzuki-swift"><img src="https://www.salvageprophet.co.uk/badge/suzuki-swift.svg" width="340" height="92" alt="Suzuki Swift MOT Pass Rate: 77.3% - Salvage Prophet"></a>Run a garage or parts site? Embed the Suzuki Swift's top real failure reason instead, linked back here.
<a href="https://www.salvageprophet.co.uk/mot/suzuki-swift"><img src="https://www.salvageprophet.co.uk/badge/failure/suzuki-swift.svg" width="340" height="106" alt="Suzuki Swift most common MOT failure: Brake pipe damaged or excessively corroded (4.7% of tests) - Salvage Prophet"></a>